


Today’s report: US administration unpredictability not easy for investors
The central focus in financial markets continues to be on impact and fallout from US administration policies. Investors have been trying to find confidence in recent sessions but have yet to succeed in getting past all of the stress around the unpredictability of Trump.
Wake-up call
- No news
- Gilt yields
- Hot inflation
- inflation data
- Auto tariffs
- tariff risk
- Trump policies
- Macro themes
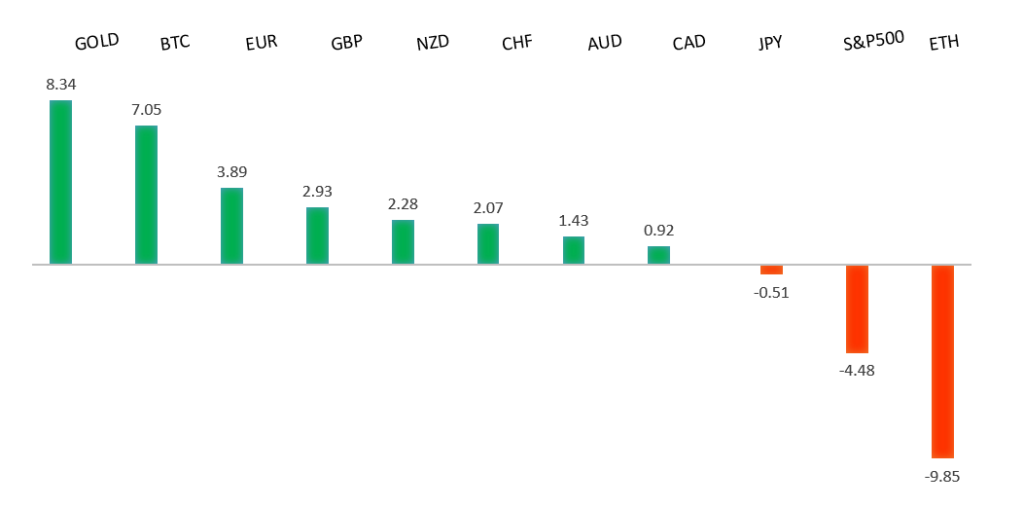
Peformance chart: 30-Day Performance vs. US dollar (%)
Suggested reading
- Why governments are 'addicted' to debt, D. Garahan, Financial Times (March 27, 2025)
- Should You Tweak Your Withdrawal Rate for 2025?, C. Benz, Morningstar (March 27, 2025)
Chart talk: Technical & fundamental highlights
Choose pair:
EURUSD – technical overview
The Euro has been in a multi-month consolidation since bottoming out in 2022. Setbacks have since been exceptionally well supported on dips towards parity, with a higher platform sought out ahead of the next major upside extension. Look for a push back towards the 2023 high at 1.1276 in the days ahead. Only a monthly close below 1.0000 negates.EURUSD – fundamental overview
We didn't get any first-tier data out of the Eurozone on Thursday and it turns out no news was good news for the single currency. Key standouts on Friday’s calendar come from German consumer confidence, UK retail sales, trade, business investment, and GDP, ECB speak, Eurozone sentiment reads, Canada GDP, US personal income, personal spending, core PCE, Michigan sentiment, and Fed speak.EURUSD - Technical charts in detail
GBPUSD – technical overview
Signs have emerged of the market wanting to put in a longer-term base after collapsing to a record low in September 2022. The door is now open for the next major upside extension towards the 2018 high at 1.4377. Setbacks should be well supported above 1.2000 on a monthly close basis.GBPUSD – fundamental overview
A Thursday spike in Gilt yields helped to invite renewed demand for the Pound on dips. Key standouts on Friday’s calendar come from German consumer confidence, UK retail sales, trade, business investment, and GDP, ECB speak, Eurozone sentiment reads, Canada GDP, US personal income, personal spending, core PCE, Michigan sentiment, and Fed speak.USDJPY – technical overview
There are signs of a meaningful top in place after the market put in a multi-year high in 2024. At this point, the door is now open for a deeper setback towards the 140 area.USDJPY – fundamental overview
Inflation data out of Japan on Friday has come out on the hotter side of expectation, fueling a wave of renewed demand for the Yen on hawkish expectations from the BOJ. Key standouts on Friday’s calendar come from German consumer confidence, UK retail sales, trade, business investment, and GDP, ECB speak, Eurozone sentiment reads, Canada GDP, US personal income, personal spending, core PCE, Michigan sentiment, and Fed speak.AUDUSD – technical overview
There are signs of the potential formation of a longer-term base with the market trading down into a meaningful longer-term support zone. Only a monthly close below 0.6000 would give reason for rethink. A monthly close back above 0.7000 will take the big picture pressure off the downside and strengthen case for a bottom.AUDUSD – fundamental overview
The Australian Dollar has run into some headwinds on the back of risk off flow and easing Aussie inflation data the other day. Key standouts on Friday’s calendar come from German consumer confidence, UK retail sales, trade, business investment, and GDP, ECB speak, Eurozone sentiment reads, Canada GDP, US personal income, personal spending, core PCE, Michigan sentiment, and Fed speak.USDCAD – technical overview
A sustained hold above 1.3000 over the past several months signals an end to a period of longer-term bearish consolidation and suggests the market is in the process of carving out a more significant longer-term base. Next key resistance now comes in at the 1.5000 psychological barrier. Setbacks should be very well supported ahead of 1.4000.USDCAD – fundamental overview
The Canadian Dollar hasn't been able to escape the stress around tariffs. After a period of minor relief on some calm around the arrival of PM Carney, the currency is back under pressure as auto tariffs worry locals. Key standouts on Friday’s calendar come from German consumer confidence, UK retail sales, trade, business investment, and GDP, ECB speak, Eurozone sentiment reads, Canada GDP, US personal income, personal spending, core PCE, Michigan sentiment, and Fed speak.NZDUSD – technical overview
Overall pressure remains on the downside with the market continuing to stall out on runs up into the 0.6500 area. At the same time, there are some signs of the market wanting to put in a longer-term base. Ultimately, a break back above 0.6500 would be required to take the medium-term pressure off the downside and encourage this prospect. A monthly close below 0.5469 will intensify bearish price action.NZDUSD – fundamental overview
The New Zealand Dollar is once again facing downside pressure on the back of bigger picture risk off flows that are weighing on the correlated currency. Key standouts on Friday’s calendar come from German consumer confidence, UK retail sales, trade, business investment, and GDP, ECB speak, Eurozone sentiment reads, Canada GDP, US personal income, personal spending, core PCE, Michigan sentiment, and Fed speak.US SPX 500 – technical overview
The longer term uptrend remains intact and dips continue to be exceptionally well supported. Critical support comes in at 5386, with only a weekly close back below this level to compromise the structure. Until then, the focus remains on the formation of the next major higher low.US SPX 500 – fundamental overview
Going forward, it will be important to keep an eye on Trump trade policies, inflation, bigger picture economic data and the Fed policy outlook. Any of these variables are capable of easily ruffling some feathers and we've already seen a little of this as 2025 gets going.GOLD (SPOT) – technical overview
The 2019 breakout above the 2016 high at 1375 was a significant development, opening the door for fresh record highs and this next major upside extension towards 3500. Setbacks should now be well supported above 2800 on a monthly close basis.GOLD (SPOT) – fundamental overview
The yellow metal has pushed record highs in recent months with solid demand from medium and longer-term accounts. These players are more concerned about inflation, geopolitical risk and a less upbeat global growth outlook. All of this should keep the commodity well supported over the coming months.