


Next 24 hours: Fed Minutes come into focus
Today’s report: Taking it all in stride
The market is clearly becoming less nervous about headlines around tariffs. President Trump was on the wires talking 25% tariffs on automobile, semiconductor, and pharmaceutical products and the market took it all in stride rather than panicking as we had seen weeks back.
Wake-up call
- current account
- employment, wages
- BOJ Takata
- wage prices
- Minister Ebrard
- RBNZ cuts
- Trump policies
- Macro themes
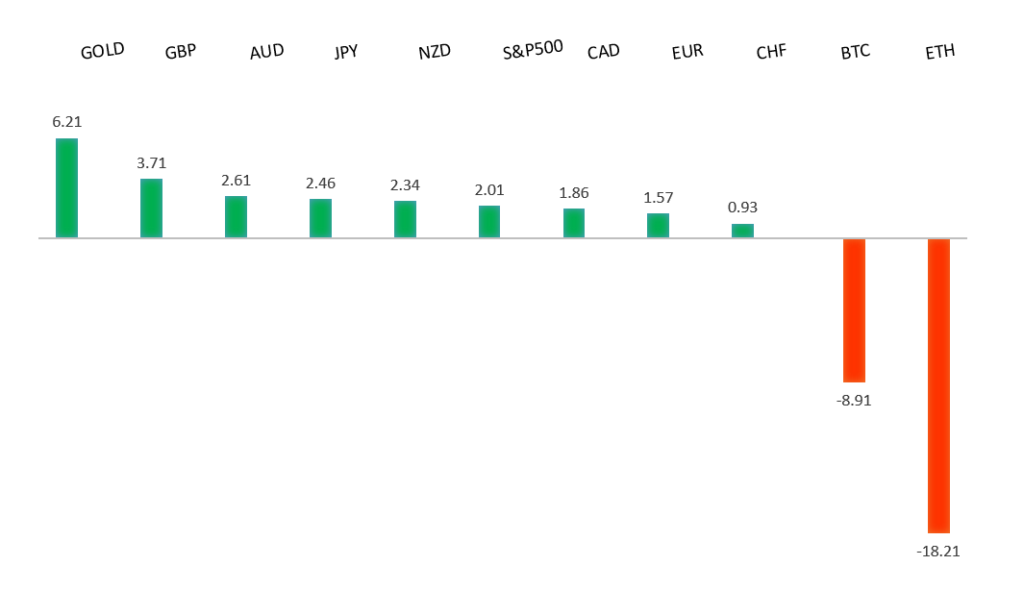
Peformance chart: 30-Day Performance vs. US dollar (%)
Suggested reading
- Fertility and the AI event horizon, S. Sumner, The Pursuit of Happiness (February 14, 2025)
- The 4 Warren Buffett Stocks to Buy, S. Dziubinski, Morningstar (February 15, 2025)
Chart talk: Technical & fundamental highlights
Choose pair:
EURUSD – technical overview
The Euro has been in a multi-month consolidation since bottoming out in 2022. Setbacks have since been exceptionally well supported on dips towards parity, with a higher platform sought out ahead of the next major upside extension. Look for a major bounce in the days ahead and the start to a push back towards the 2023 high at 1.1276. Only a monthly close below 1.0000 negates.EURUSD – fundamental overview
The Euro is trying to find more support after the Eurozone ZEW survey topped estimates. Meanwhile, French CPI came in hotter than expected. Key standouts on today’s calendar come from UK inflation, the Eurozone current account, US housing starts, building permits, and the Fed Minutes.EURUSD - Technical charts in detail
GBPUSD – technical overview
Signs have emerged of the market wanting to put in a longer-term base after collapsing to a record low in September 2022. The door is now open for the next major upside extension towards the 2018 high at 1.4377. Setbacks should be well supported above 1.2000 on a monthly close basis.GBPUSD – fundamental overview
Strong growth in UK wages and employment have helped to give the Pound an added prop into the mid-week. Key standouts on today’s calendar come from UK inflation, the Eurozone current account, US housing starts, building permits, and the Fed Minutes.USDJPY – technical overview
The market is looking to resume the longer-term uptrend after an intense correction in 2024. A higher low is ideally sought out above 140.00 in favor of a bullish continuation. The October monthly close back above 150.00 strengthens the case for longer-term uptrend resumption.USDJPY – fundamental overview
Stronger economic data out of Japan has been backing up the shift towards a hawkish BOJ policy stance. BOJ Board member Takata was on the wires reaffirming this outlook after saying "it's important for the bank to continue policy adjustments even after last month's rate hike in order to avoid creating excessively high expectations that monetary easing might persist." Key standouts on today’s calendar come from UK inflation, the Eurozone current account, US housing starts, building permits, and the Fed Minutes.AUDUSD – technical overview
There are signs of the potential formation of a longer-term base with the market trading down into a meaningful longer-term support zone. Only a monthly close below 0.6000 would give reason for rethink. A monthly close back above 0.7000 will take the big picture pressure off the downside and strengthen case for a bottom.AUDUSD – fundamental overview
We haven't seen much movement in the Australian Dollar following Tuesday's hawkish cut. But today's data backs up the case for cutting rates after the wage price index came in below forecast. Key standouts on today’s calendar come from UK inflation, the Eurozone current account, US housing starts, building permits, and the Fed Minutes.USDCAD – technical overview
A sustained hold above 1.3000 over the past several months signals an end to a period of longer-term bearish consolidation and suggests the market is in the process of carving out a more significant longer-term base. Next key resistance now comes in at the 1.5000 psychological barrier. Setbacks should be very well supported ahead of 1.4000.USDCAD – fundamental overview
The alleviation of stress around trade tariffs has given the Canadian Dollar more reason to want to extend its recovery. Risk sentiment has also turned back up, while the price of oil looks to be stabilizing. Canada Economy Minister Ebrard will be in DC today through the end of week to discuss trade policy with US Commerce Secretary Lutnick. Key standouts on today’s calendar come from UK inflation, the Eurozone current account, US housing starts, building permits, and the Fed Minutes.NZDUSD – technical overview
Overall pressure remains on the downside with the market continuing to stall out on runs up into the 0.6500 area. At the same time, there are some signs of the market wanting to put in a longer-term base. Ultimately, a break back above 0.6500 would be required to take the medium-term pressure off the downside and encourage this prospect. A monthly close below 0.5469 will intensify bearish price action.NZDUSD – fundamental overview
The RBNZ was out earlier today and cut rates by 50 basis points as was widely expected. The New Zealand Dollar held up well despite the cut given the event was already well telegraphed. Comments from RBNZ Orr that future rate cuts will be smaller may have helped to add to Kiwi support. Key standouts on today’s calendar come from UK inflation, the Eurozone current account, US housing starts, building permits, and the Fed Minutes.US SPX 500 – technical overview
The longer term uptrend remains intact and dips continue to be exceptionally well supported. Critical support comes in at 5679, with only a break back below this level to compromise the structure and open the door for a more significant corrective decline. Until then, the focus remains on a continued push to fresh record highs.US SPX 500 – fundamental overview
Investors are feeling better about a soft landing in the US economy. Moreover, there has been a fresh wave of market optimism in anticipation of a market bullish Trump presidency. It will however be important to keep an eye on Trump trade policies, inflation, bigger picture economic data and the latest shift in the Fed dot plot. Any of these variables are capable of easily ruffling some feathers and we've already seen a little of this as 2025 gets going.GOLD (SPOT) – technical overview
The 2019 breakout above the 2016 high at 1375 was a significant development, opening the door for fresh record highs and this next major upside extension into the 3000 area. Setbacks should now be well supported above 2500 on a monthly close basis.GOLD (SPOT) – fundamental overview
The yellow metal has pushed record highs in recent months with solid demand from medium and longer-term accounts. These players are more concerned about inflation, geopolitical risk and a less upbeat global growth outlook. All of this should keep the commodity well supported over the coming months.