


Next 24 hours: Australian Dollar hit hardest post RBA decision
Today’s report: It's all feeling a little too extended
We warned market moves were looking extended following the latest wave of Dollar weakness and equity market strength. And into Tuesday, as per our warning, we are seeing a readjustment of positions, with traders perhaps recognizing they may have gotten a little too aggressive with bets for an all-out reversal of Fed policy.
Wake-up call
- Leveraged funds
- Profit taking
- Masaaki Shirakawa
- RBA holds
- Oil slide
- trade data
- Inflation risk
- Global outlook
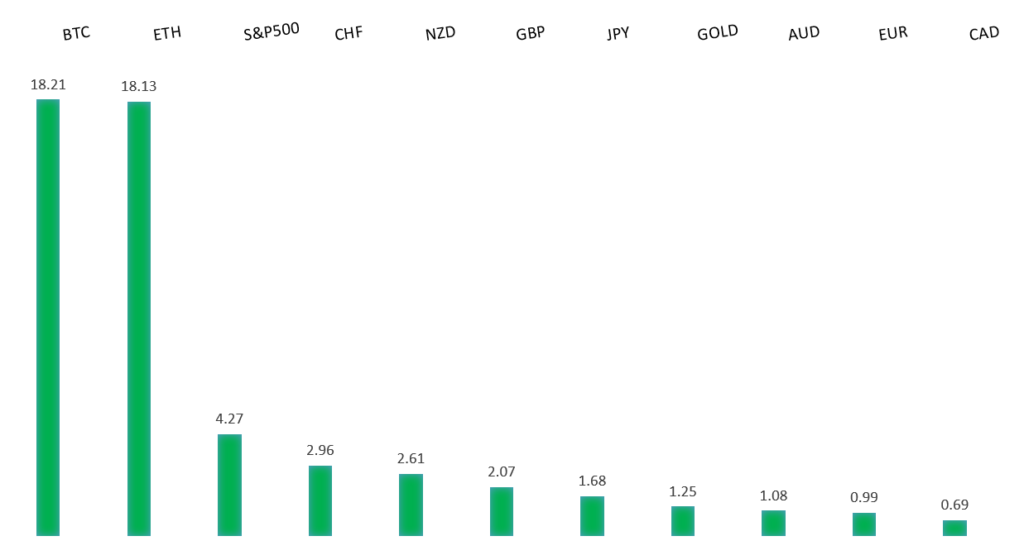
Peformance chart: 30 Day Performance vs. US dollar (%)
Suggested reading
- The Fed’s Alleged 'Inflation Fight' Was a Big, Fat Non Sequitur, Forbes (December 3, 2023)
- Crispr Gene Editing Technology Could Transform Medicine, Financial Times (December 5, 2023)
Chart talk: Technical & fundamental highlights
Choose pair:
EURUSD – technical overview
The Euro has been in a multi-month consolidation since bottoming out in 2022. Setbacks have since been exceptionally well supported on dips below 1.0500, with a higher platform sought out ahead of the next major upside extension. Look for a push through the yearly high at 1.1276 to strengthen the constructive outlook and extend the recovery run towards 1.2000. Only back below 1.0400 negates.EURUSD – fundamental overview
The Euro has been under pressure in recent sessions, with a run of softer inflation data out of the Zone fueling the pullback. Bloomberg has been out reporting of leveraged funds buying Euro put options for shorting against several other currencies, with option tenors noted at mostly three months or shorter, with some up to six months. Key standouts on Tuesday’s calendar come from Eurozone, German, and UK services PMIs, Eurozone producer prices, US ISM services, and US JOLTs job openings.EURUSD - Technical charts in detail
GBPUSD – technical overview
Signs have emerged of the market wanting to put in a longer-term base after collapsing to a record low in September 2022. The November 2022 monthly close back above 1.2000 strengthens this prospect. Any setbacks should now be well supported ahead of 1.2000. Next key resistance comes in at 1.2818.GBPUSD – fundamental overview
The Pound has seen a round of profit taking after an impressive run to the topside. Absence of UK data on Monday has contributed to the market wanting to lighten up a bit on long GBP exposure. Key standouts on Tuesday’s calendar come from Eurozone, German, and UK services PMIs, Eurozone producer prices, US ISM services, and US JOLTs job openings.USDJPY – technical overview
The market remains confined to a strong uptrend, with sights set on a retest and break of the multi-year high from 2022 at 151.95. A push through this level will open the next major upside extension towards 155.00. Key support comes in at 145.00, with only a weekly close below to delay the constructive outlook.USDJPY – fundamental overview
Former BOJ Governor Masaaki Shirakawa wrote a piece for Nikkei with the subheading 'logic of government's personal tax cut plan is hard to understand,,' calling the recent move by the Japanese government to cut personal income taxes as "the most puzzling policy to emerge in Japan over the past decade." Key standouts on Tuesday’s calendar come from Eurozone, German, and UK services PMIs, Eurozone producer prices, US ISM services, and US JOLTs job openings.AUDUSD – technical overview
There are signs of the potential formation of a longer-term base with the market trading down into a meaningful longer-term support zone. Only a monthly close below 0.6200 would give reason for rethink. Back above 0.6900 will take the big picture pressure off the downside and strengthen case for a bottom.AUDUSD – fundamental overview
Earlier today, the RBA kept rates unchanged at 4.35% as expected and said further tightening would be data dependent. But, cooling inflation and a softening labor market suggest its policy tightening to date is gaining traction. The Bank also said wage growth is not expected to increase much further, though there are uncertainties as to how companies will adjust wages in response to the slowing economy at a time when the labor market remains tight. Key standouts on Tuesday’s calendar come from Eurozone, German, and UK services PMIs, Eurozone producer prices, US ISM services, and US JOLTs job openings.USDCAD – technical overview
Above 1.3000 signals an end to a period of longer-term bearish consolidation and suggests the market is in the process of carving out a more significant longer-term base. Next key resistance now comes in up into the 1.4000 area. Setbacks should be very well supported down into the 1.3000 area.USDCAD – fundamental overview
All of the upside from a round of solid Canada economic data last week has now faded away, with the Loonie coming back under pressure from sliding oil, broader downside pressure on commodities, and a pullback in US equities. Key standouts on Tuesday’s calendar come from Eurozone, German, and UK services PMIs, Eurozone producer prices, Canada services PMIs, US ISM services, and US JOLTs job openings.NZDUSD – technical overview
Overall pressure remains on the downside with the market continuing to stall out on runs up into the 0.6500 area. At the same time, there are some signs of the market wanting to put in a longer-term base. Ultimately, a break back above 0.6500 would be required to take the medium-term pressure off the downside and encourage this prospect. A monthly close below 0.5800 will intensify bearish price action.NZDUSD – fundamental overview
The New Zealand Dollar is holding up better than its commodity currency cousins, getting help from Kiwi trade data that came out better than expected the other day. Key standouts on Tuesday’s calendar come from Eurozone, German, and UK services PMIs, Eurozone producer prices, US ISM services, and US JOLTs job openings.US SPX 500 – technical overview
Longer-term technical studies are in the process of unwinding from extended readings off record highs. Look for rallies to be well capped in favor of lower tops and lower lows. A monthly close back above 4600 will be required to take the immediate pressure off the downside. Next key support comes in at 4308.US SPX 500 – fundamental overview
Investors continue to struggle with the reality of a higher for longer Fed policy track in the face of ongoing worry around inflation, while also contending with geopolitical risk in 2023. Overall, we expect inflation to continue to be a problem in 2023 that results in downside pressure into rallies despite recent data and market expectations that would argue otherwise.GOLD (SPOT) – technical overview
The 2019 breakout above the 2016 high at 1375 was a significant development, opening the door for fresh record highs. Setbacks should now be well supported above 1900 on a monthly close basis ahead of the next major upside extension towards 2500.GOLD (SPOT) – fundamental overview
The yellow metal continues to be well supported on dips with solid demand from medium and longer-term accounts. These players are more concerned about inflation risk and a less stable and upbeat global growth outlook. All of this should keep the commodity well supported, with many market participants also fleeing to the hard asset as the grand dichotomy of record high equities and record low yields comes to an unnerving climax.