


Today’s report: Soft US data stokes recession fears
A round of discouraging survey data out of the US on Tuesday has fueled more selling of the US Dollar as the market prices in increased odds for recession. Philly Fed services and consumer confidence polls plunged to post-pandemic lows while consumer expectations faltered on worry over personal finances.
Wake-up call
- ECB Kazimir
- alternative
- BOJ Minutes
- RBA forecasts
- PM Carney
- labor conditions
- Trump policies
- Macro themes
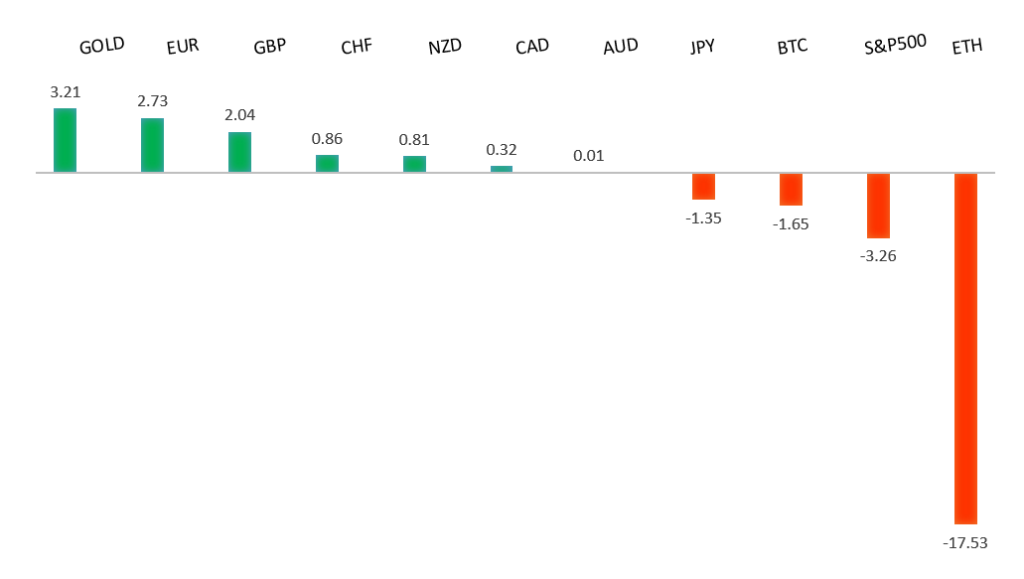
Peformance chart: 30-Day Performance vs. US dollar (%)
Suggested reading
- The unluckiest market timer I know, S. Ro, TKER (March 23, 2025)
- Ignoring China’s burgeoning tech sector not wise, S. McBride RiskHedge (March 13, 2025)
Chart talk: Technical & fundamental highlights
Choose pair:
EURUSD – technical overview
The Euro has been in a multi-month consolidation since bottoming out in 2022. Setbacks have since been exceptionally well supported on dips towards parity, with a higher platform sought out ahead of the next major upside extension. Look for a push back towards the 2023 high at 1.1276 in the days ahead. Only a monthly close below 1.0000 negates.EURUSD – fundamental overview
The Euro is starting to show signs of stabilizing after taking in an upturn in German Ifo data and some hawkish speak from ECB Kazimir. Key standouts on Wednesday’s calendar come from UK inflation data, Canada wholesale sales, US durable goods, Fed speak, the Bank of Canada Summary of Deliberations, and ECB speak.EURUSD - Technical charts in detail
GBPUSD – technical overview
Signs have emerged of the market wanting to put in a longer-term base after collapsing to a record low in September 2022. The door is now open for the next major upside extension towards the 2018 high at 1.4377. Setbacks should be well supported above 1.2000 on a monthly close basis.GBPUSD – fundamental overview
Market sentiment towards the Pound is running high amidst global trade tensions. The UK is less vulnerable to potential fallout and this is reflecting in the price action. The currency has even done a good job shrugging off weaker CBI numbers. Key standouts on Wednesday’s calendar come from UK inflation data, Canada wholesale sales, US durable goods, Fed speak, the Bank of Canada Summary of Deliberations, and ECB speak.USDJPY – technical overview
There are signs of a meaningful top in place after the market put in a multi-year high in 2024. At this point, the door is now open for a deeper setback towards the 140 area.USDJPY – fundamental overview
A hawkish leaning BOJ Minutes may be helping to invite some renewed Yen demand after the currency had been taking a hit in recent sessions from softer economic data and worry around US tariffs. Key standouts on Wednesday’s calendar come from UK inflation data, Canada wholesale sales, US durable goods, Fed speak, the Bank of Canada Summary of Deliberations, and ECB speak.AUDUSD – technical overview
There are signs of the potential formation of a longer-term base with the market trading down into a meaningful longer-term support zone. Only a monthly close below 0.6000 would give reason for rethink. A monthly close back above 0.7000 will take the big picture pressure off the downside and strengthen case for a bottom.AUDUSD – fundamental overview
The Australian Dollar has been generating more bids after the RBA forecast 2.25% GDP in 2025-2026 from 1.4% in 2023-2024. Key standouts on Wednesday’s calendar come from UK inflation data, Canada wholesale sales, US durable goods, Fed speak, the Bank of Canada Summary of Deliberations, and ECB speak.USDCAD – technical overview
A sustained hold above 1.3000 over the past several months signals an end to a period of longer-term bearish consolidation and suggests the market is in the process of carving out a more significant longer-term base. Next key resistance now comes in at the 1.5000 psychological barrier. Setbacks should be very well supported ahead of 1.4000.USDCAD – fundamental overview
The Canadian Dollar has been better bid in recent sessions, getting a boost from the news that PM Carney expresses a willingness to negotiate with the US on trade tariffs. Key standouts on Wednesday’s calendar come from UK inflation data, Canada wholesale sales, US durable goods, Fed speak, the Bank of Canada Summary of Deliberations, and ECB speak.NZDUSD – technical overview
Overall pressure remains on the downside with the market continuing to stall out on runs up into the 0.6500 area. At the same time, there are some signs of the market wanting to put in a longer-term base. Ultimately, a break back above 0.6500 would be required to take the medium-term pressure off the downside and encourage this prospect. A monthly close below 0.5469 will intensify bearish price action.NZDUSD – fundamental overview
We've been seeing some relative weakness in the New Zealand Dollar, with the currency getting dragged down by a dovish RBNZ outlook and this latest news backing the outlook up after the central bank said labor conditions were deteriorating. Kiwi has however been better bid against the US Dollar in recent sessions on the back of a rebound in US equities. Key standouts on Wednesday’s calendar come from UK inflation data, Canada wholesale sales, US durable goods, Fed speak, the Bank of Canada Summary of Deliberations, and ECB speak.US SPX 500 – technical overview
The longer term uptrend remains intact and dips continue to be exceptionally well supported. Critical support comes in at 5386, with only a weekly close back below this level to compromise the structure. Until then, the focus remains on the formation of the next major higher low.US SPX 500 – fundamental overview
Going forward, it will be important to keep an eye on Trump trade policies, inflation, bigger picture economic data and the Fed policy outlook. Any of these variables are capable of easily ruffling some feathers and we've already seen a little of this as 2025 gets going.GOLD (SPOT) – technical overview
The 2019 breakout above the 2016 high at 1375 was a significant development, opening the door for fresh record highs and this next major upside extension towards 3100. Setbacks should now be well supported above 2500 on a monthly close basis.GOLD (SPOT) – fundamental overview
The yellow metal has pushed record highs in recent months with solid demand from medium and longer-term accounts. These players are more concerned about inflation, geopolitical risk and a less upbeat global growth outlook. All of this should keep the commodity well supported over the coming months.