


Next 24 hours: Canadian Dollar hits lowest level since April 2020
Today’s report: RBA holds but more dovish than expected
We’re seeing a lot of consolidation in markets ahead of some key economic data and central bank policy risk later this week. This includes tomorrow’s Bank of Canada decision and US inflation data, and an ECB decision on Thursday.
Wake-up call
- Investor confidence
- dovish speak
- Cross-related selling
- dovish tweak
- BoC cut
- in sympathy
- political outlook
- Macro themes
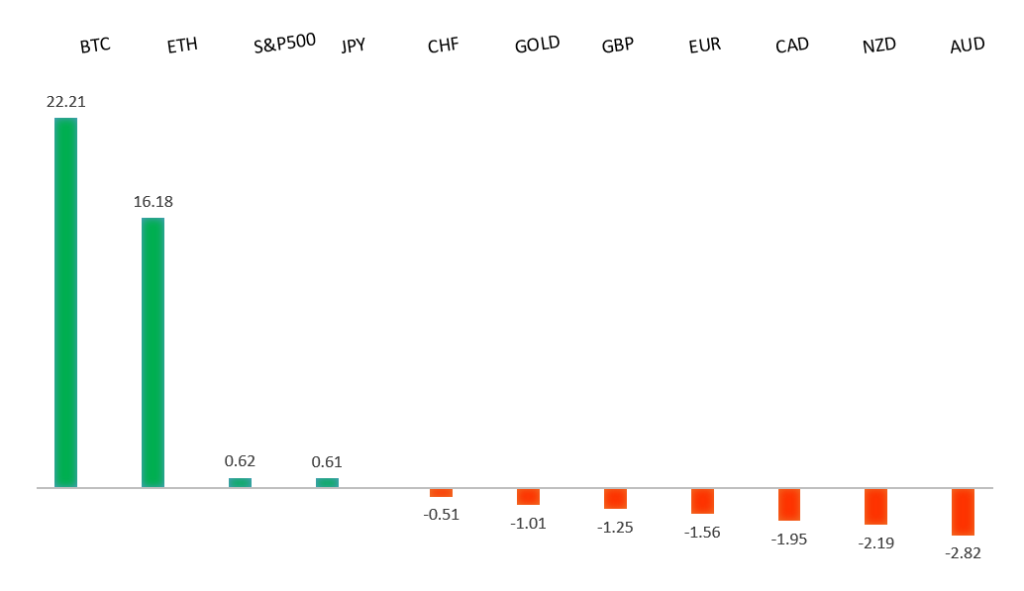
Peformance chart: 30-Day Performance vs. US dollar (%)
Suggested reading
- How safety lapses hit Boeing's reputation, J. Sandy, Financial Times (December 10, 2024)
- Bitcoin hit $100,000. What’s next?, S. McBride, RiskHedge (December 6, 2024)
Chart talk: Technical & fundamental highlights
Choose pair:
EURUSD – technical overview
The Euro has been in a multi-month consolidation since bottoming out in 2022. Setbacks have since been exceptionally well supported on dips below 1.0500, with a higher platform sought out ahead of the next major upside extension. Look for a major bounce in the days ahead and the start to a push back towards the 2023 high at 1.1276. Only a monthly close below 1.0400 negates.EURUSD – fundamental overview
EMU Sentix Investor Confidence came in soft on Monday and the Euro continues to struggle ahead of Thursday's anticipated ECB rate cut. Key standouts on Tuesday’s calendar come from German inflation and US NFIB business optimism.EURUSD - Technical charts in detail
GBPUSD – technical overview
Signs have emerged of the market wanting to put in a longer-term base after collapsing to a record low in September 2022. The door is now open for the next major upside extension towards the 2018 high at 1.4377. Setbacks should be well supported above 1.2500 on a monthly close basis.GBPUSD – fundamental overview
Absence of first tier data out of the UK leaves the Pound still thinking about recent dovish comments from BOE Dhingra. The central banker suggested current rates were high relative to the current economic reality in the UK. Key standouts on Tuesday’s calendar come from German inflation and US NFIB business optimism.USDJPY – technical overview
The market is looking to resume the longer-term uptrend after an intense correction in 2024. A higher low is ideally sought out above 140.00 in favor of a bullish continuation. The recent weekly close back above 150.00 strengthens the case for longer-term uptrend resumption.USDJPY – fundamental overview
It's been a quiet Tuesday thus far. What little we have seen is some Yen demand on the back of cross related AUDJPY selling in the aftermath of the more dovish leaning RBA decision. Key standouts on Tuesday’s calendar come from German inflation and US NFIB business optimism.AUDUSD – technical overview
There are signs of the potential formation of a longer-term base with the market trading down into a meaningful longer-term support zone. Only a monthly close below 0.6200 would give reason for rethink. A monthly close back above 0.7000 will take the big picture pressure off the downside and strengthen case for a bottom.AUDUSD – fundamental overview
Earlier today, the RBA left rates on hold as expected but delivered a more dovish than expected communication. The central bank tweaked its language of reaffirming policy needed to stay more restrictive to being more confident inflation was heading in the right direction. Key standouts on Tuesday’s calendar come from German inflation and US NFIB business optimism.USDCAD – technical overview
A sustained hold above 1.3000 over the past several months signals an end to a period of longer-term bearish consolidation and suggests the market is in the process of carving out a more significant longer-term base. Next key resistance now comes in up into the 1.4500-1.5000 area, exposing a retest of the 2020 high just ahead of 1.4700. Setbacks should be very well supported down into the 1.3000 area.USDCAD – fundamental overview
The Canadian Dollar hasn't been able to get away from softer economic data and the odds for more aggressive Bank of Canada cuts at tomorrow's meeting. Last Friday's jobs data showed a jump in the unemployment rate and softness in wage data. Key standouts on Tuesday’s calendar come from German inflation and US NFIB business optimism.NZDUSD – technical overview
Overall pressure remains on the downside with the market continuing to stall out on runs up into the 0.6500 area. At the same time, there are some signs of the market wanting to put in a longer-term base. Ultimately, a break back above 0.6500 would be required to take the medium-term pressure off the downside and encourage this prospect. A monthly close below 0.5800 will intensify bearish price action.NZDUSD – fundamental overview
There hasn't been a lot of the New Zealand Dollar to be excited about in recent days. RBNZ Orr has signaled another 50-basis point rate cut, US NFP data came in on the stronger side, China continues to show signs of economic sluggishness, made worst by the added fear around trade tension with the incoming US administration, and the RBA just came out leaning more dovish. Key standouts on Tuesday’s calendar come from German inflation and US NFIB business optimism.US SPX 500 – technical overview
The longer term uptrend remains intact and dips continue to be exceptionally well supported. Critical support comes in at 5679, with only a break back below this level to compromise the structure and open the door for a more significant corrective decline. Until then, the focus remains on a continued push to fresh record highs.US SPX 500 – fundamental overview
The US equities market remains exceptionally well supported in 2024 on the back of an ongoing expectation for more rate cuts than less going forward. Investors are feeling better about a soft landing in the US economy and this has also been accompanied by an accommodative adjustment of Fed policy. Moreover, there has been a fresh wave of market optimism in the aftermath of the Trump election victory. It will however be important to keep an eye on inflation, bigger picture economic data, and geopolitical risk in the weeks and months ahead.GOLD (SPOT) – technical overview
The 2019 breakout above the 2016 high at 1375 was a significant development, opening the door for fresh record highs and this next major upside extension into the 3000 area. Setbacks should now be well supported above 2500 on a monthly close basis.GOLD (SPOT) – fundamental overview
The yellow metal has pushed record highs in 2024 with solid demand from medium and longer-term accounts. These players are more concerned about inflation, geopolitical risk and a less upbeat global growth outlook. All of this should keep the commodity well supported over the coming months.